
Spending vs. Educational Outcomes
- Collectivism vs. Community
- Testify to What?
- Just a Spell Too Far
- 9/12/2001
- The Nuclear Family: The Standard We Stopped Defending
My wife is a teacher at a public school as one of her many careers. I get a firsthand account of the state of public school education in Tennessee. So, when this article came out, I dove in. And I heard the same, tired song.
Tennessee’s Rank in Public School Spending
The newest rage in Tennessee is that the state registered lowest in the country in public school spending. This predictably outraged various groups of uninformed, rage-baiters into the playbook manual of feelings of over facts:
- Feel angry
- Call it out
- See evidence-based refutation
- Name-call and scream louder
Rather than look to see why, or if this is even something to be concerned about, how bad it is, they just came out swinging. I dug into it a little. Questions I had were:
- Where did Tennessee rank in educational outcomes?
- Does spending correlate to educational outcomes?
Educational Outcomes
What I found- Tennessee is slightly above national average
Tennessee ranks:
- 25th in combined proficiency
- 24th in 4th grade reading
- 21st in 8th grade reading
- 13th in 4th grade math
- 20th in 8th grade math
- One of the fastest improving states in the country.
So let me get this straight. Tennessee ranks lowest in public school spending but above the national average in educational outcomes? This alone indicates a lack of causation between spending and educational outcomes.
By the Numbers
But don’t take my word for it. Let’s actually look at numbers.
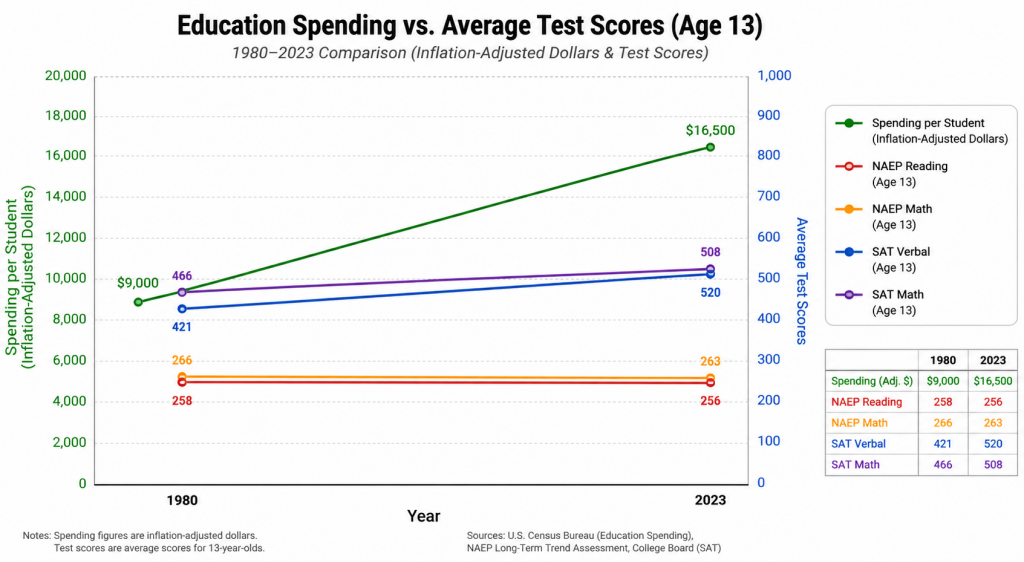
Spending
1980: $2300 per student ($9,000 in today’s dollars)
2023: $16,500 per student (National average is now $18,000. Some states exceed $20,000)
Right away, you would expect to see educational output almost double over this same time period. Unfortunately, this isn’t supported by the data.
Educational Outcomes
1980:
NAEP Testing age 13- reading 258, math 266
SAT testing age 13- verbal 421, math 466
2023:
NAEP Testing age 13- reading 256, math 263
SAT testing age 13- verbal 520, math 508
Here’s a graph of what that looks like:
This data is controlling for population changes (SES, racial makeup, neighborhood disparity).
The evidence is clear. Spending has no correlation to educational outcomes. By any reasonable logic, we should expect to see an increase in educational outcomes. There is none. So if money doesn’t matter to educational outcomes, what does?
The Monopoly
Competition. The government has no incentive to produce better outcomes because there is no one to compete with. The other two alternatives to public schools are private schools and home schools. Currently, the average cost per student in Tennessee for a private school education is $13,000 per year. The average cost per student in Tennessee for a homeschool education is $2,000 per year. This means that the public school system is the ONLY FREE education offered in Tennessee. This is the literal definition of a monopoly.
Websters Dictionary: Monopoly- An exclusive privilege to carry on a business or service granted by the government. The market condition that exists when there is only one seller.
Everyone knows that competition drives costs down and quality up. Until government schools have competition, there is no incentive to be more proficient, increase educational outcomes, and reduce teacher inefficiency. You can just keep rolling along with arbitrary teacher tenure, protection for ill-behaved children, and lack of control over violence in schools.
I don’t pretend to have all the answers, but what I know is spending more money on schools is not the answer, and creating competition is at least one answer.
Stay Classy GP!
Grainger